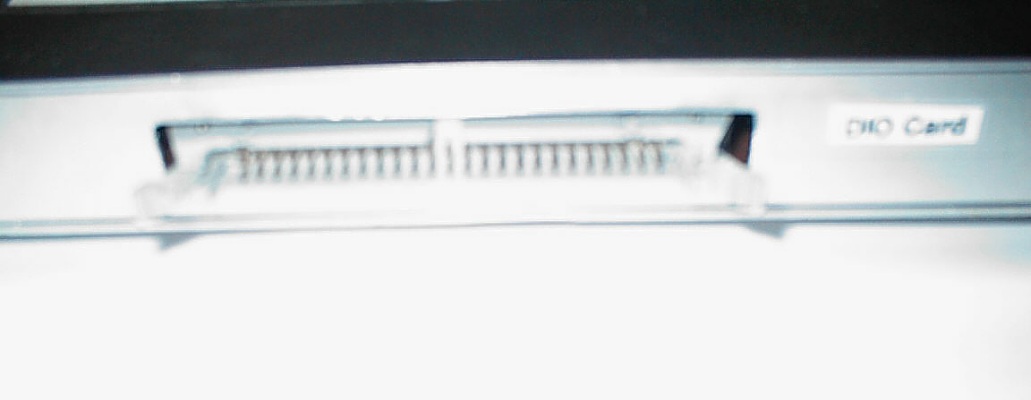
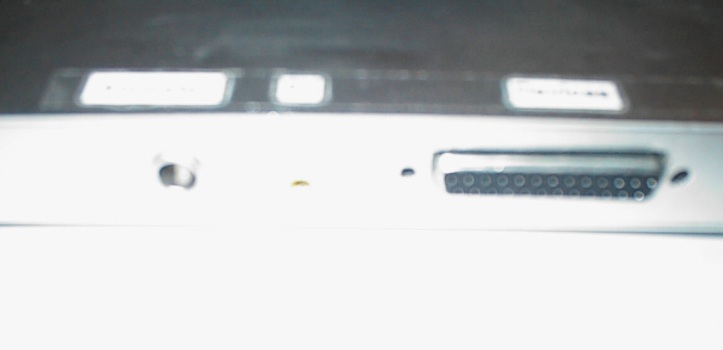
The interface between the switching matrix and the
computer is a National Instruments PC-DIO 24 ISA card. The card
has a 40-way connector. A ribbon cable is used to connect to the
identical socket on the switching matrix.
The software used to control the interface is
currently under development using Labview. The latest version of
the program can be downloaded via the following link :-
soaktest.zip(372kB)
The ZIP file contains several labview programs which can
control the switching matrix, take readings from a Keithley 617, 2410, or
similar meter, control a Bertan 225 series or Keithley 2410 power suply,
and make use of an HP34970A datalogger with 20-channel multiplexer card, all
via an IEEE-488 connection. The file should be downloaded
and unzipped to a suitable place on your hard-drive. The main
program is called soaktest.vi and this is the one which should be
opened and run.
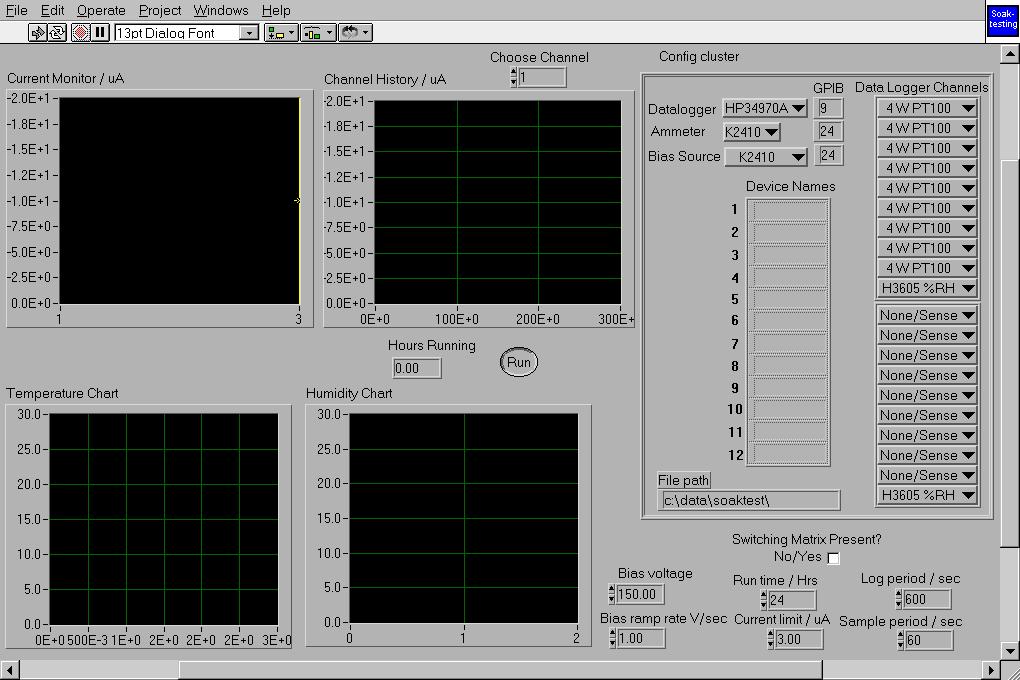
The front panel has a button which must be set to run when the
application is running and will stop the application cleanly when
switched to stop. Names should be given for the detectors in the correct
location boxes. The program will automatically measure only the channels
for which a name is given. The software can be used for soaktesting a single
detector without the switching matrix by un-checking the appropriate box.
The channels of the datalogger can be set individually for temperature or
humidity measurements using 4-wire PT-100s thermistors or Honeywell
HIH-3605 capacitive humidity sensors respectively. The length of the test can
be set and the program will automatically end when this time is reached. An
indicator on the front panel shows the time which has elapsed since the test began.
The sample period determines how often the currents, temperatures and
humidities are measured and the log period determines how often the are written
to the datafile.
A current limit can be set. If any of the channels exceed this limit the program
will ramp the voltage to zero and stop immediately.
There are also four graphs on the front panel. The first graph shows the
latest measured values of the currents on each channel in
mA. The second graph shows the
history of any one channel chosen by the user and is updatedeach time the
values are logged. The other two graphs show the temperature and humidity
measurements.
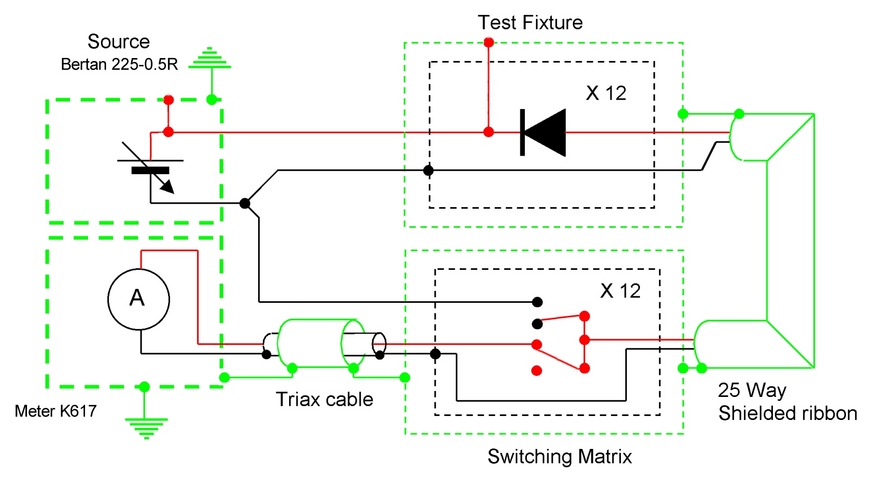
The following diagram shows how the switching matrix is connected to the detectors and to the ammeter. It also shows how the tri-axial nature of the connections is mainained (as closely as possible) throughout. It does not show the connection to the computer which is described above.
 |
Back to index |
If you cannot see the symbols on this web page correctly (there are some greek letters);
either your browser is not configured correctly or you don't have the symbol font installed.
If you are using Unix, take a look at the
TTH web site for more information.