|
|
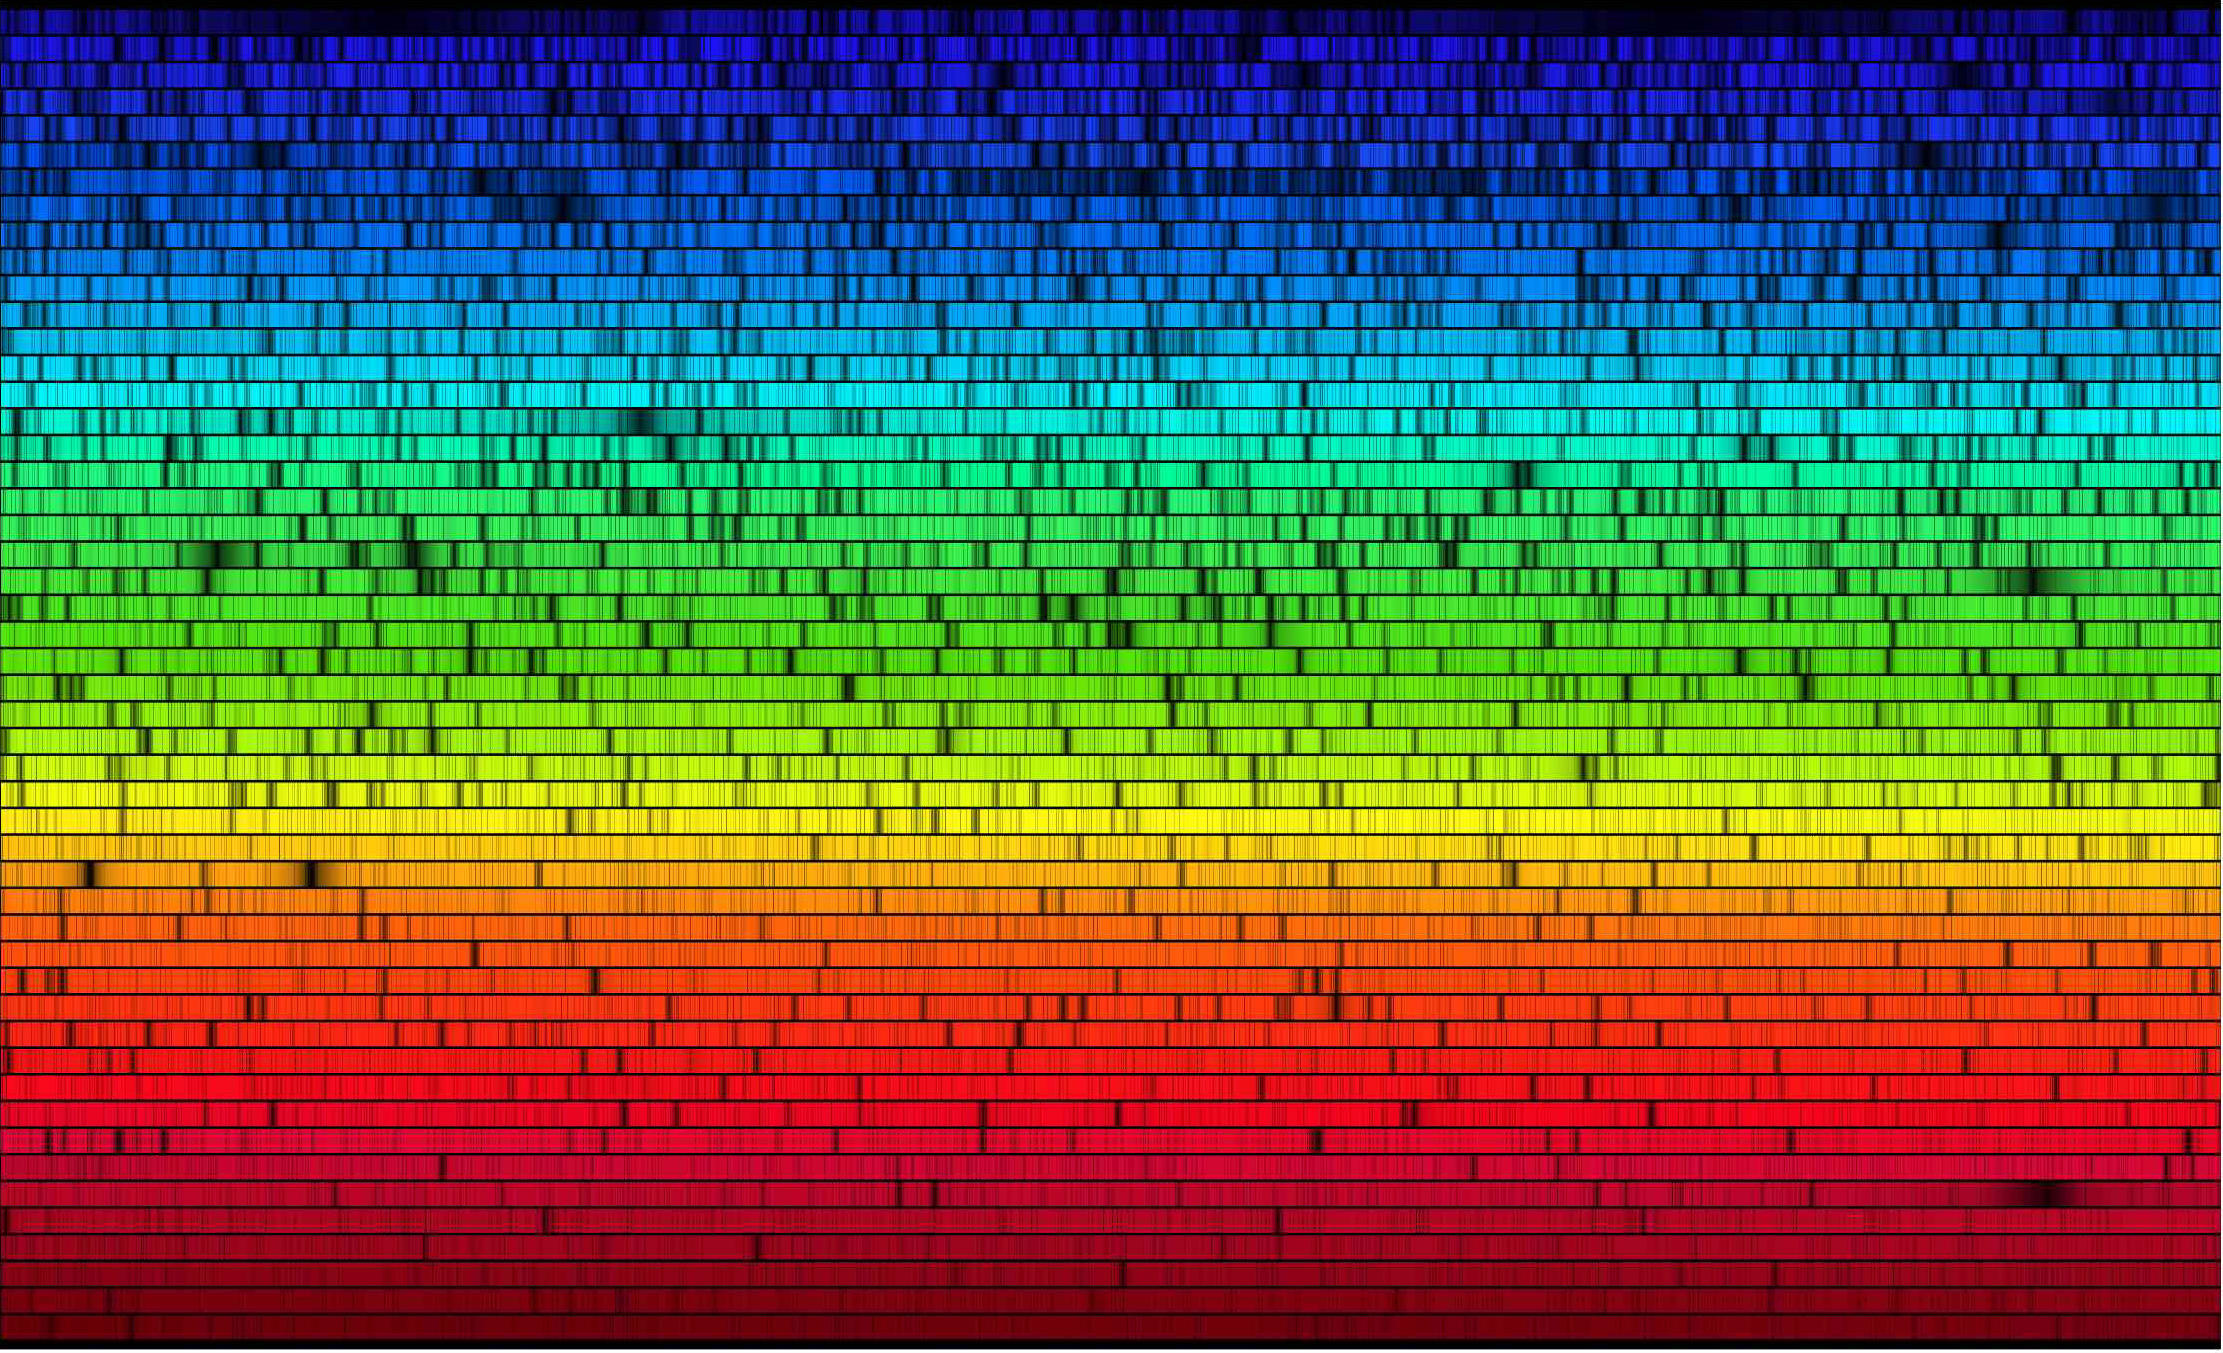 The solar spectrum at 392 nm (blue) to 692 nm (red) as observed with the Fourier Transform Spectrograph at Kitt Peak National Observatory in 1981. R. Kurucz corrected the spectrum for absorption from the Earth's atmosphere and made an atlas for public use. By analysing the lines in this spectrum, we can determine the Sun's surface temperature and chemical composition. (Taken from the Harvard-Smithsonian Center for Astrophysics website.)
|
Summary of Lecture 2 – Atoms and Starlight
-
Atoms consist of a nucleus surrounded by electrons.
- Quantum mechanics ensures that the electrons can occupy only certain well-defined energy levels;
- they can move from one energy level to another vacant level by emitting or absorbing a photon of the appropriate energy, i.e. the appropriate wavelength;
- therefore, hot gases, with many electrons in high energy levels, produce a spectrum consisting of emission lines;
- cool gas, conversely, can produce absorption lines when a background light source illuminates it.
- The positions of the lines are determined by the pattern of electron energy levels, and therefore by the type of atom (and the ionisation level).
- Hot dense substances (solids, liquids, dense gases) produce a continuous spectrum.
- In the ideal case (blackbody radiation), the properties of this spectrum depend only on the temperature of the emitting body.
- As the temperature increases, the peak of the spectrum moves towards the blue (shorter wavelengths) and the overall intensity increases.
- Stars are made of dense material (actually dense gas) with a cooler atmosphere, so they emit a continuous spectrum with superimposed absorption lines.
- The colour of the continuous spectrum tells us the temperature of the stellar surface (by applying the laws of blackbody radiation).
- The spectral lines confirm the temperature and tell us the chemical composition:
- the Sun is roughly 73% H, 25% He, 2% everything else;
- all stars are about ¾ H and ¼ He; the proportion of other elements varies from nearly zero to about 5%.
- Stars are classified into spectral types OBAFGKM based on spectral line patterns (O corresponds to hottest surface, M to coolest)
- note that although the spectral class tells us the surface temperature and is correlated with colour, it isn't based on either of those, but purely on the line patterns (the classes were devised before the relationship with temperature had been worked out, and well before colour images were used in astronomy).
- If a light source is moving towards or away from us, the observed wavelength is shifted towards the blue or red respectively (Doppler shift). This allows us to:
- observe motion of stars in binary systems (spectroscopic binaries);
- measure the mass of the Galaxy (by observing orbital motions of stars) – see lecture 7;
- study the expansion of the Universe – see lecture 10;
- detect planets around other stars – see lecture 13.
Web links
Go back to main page
Go on to Summary for Lecture 3
|
Hicks Building, Hounsfield Road, Sheffield S3 7RH, UK
|